Introduction: Why Year-End Analysis Is Your Competitive Advantage
As 2025 draws to a close, most Amazon sellers are focused on surviving the holiday rush, clearing inventory & managing increased customer service demands. But PRO sellers understand that the period between Black Friday & New Year’s represents the single most valuable strategic window of the entire year.
Amazon’s marketplace becomes more competitive every year. In 2025, we saw algorithm changes, new advertising formats, stricter compliance enforcement, AI-powered review moderation & evolving Buy Box dynamics. Sellers who enter 2026 without a data-backed growth plan aren’t just starting behind, they’re actively losing ground.
Year-end analysis isn’t about celebrating wins or mourning losses. It’s about extracting actionable intelligence from 12 months of performance data to build a strategic roadmap that compounds growth throughout 2026.This is where RootAMZ becomes your strategic partner.
As a full-service eCommerce Marketplace Account Management Company, RootAMZ specialises in transforming raw Amazon data into strategic growth plans. We help brands conduct comprehensive performance audits, identify hidden opportunities, diagnose revenue leaks & build executable 2026 roadmaps that drive sustainable profitability.
The Year-End Review Framework: What PRO Sellers Analyse
Effective year-end analysis requires examining your Amazon business through multiple lenses. Skipping any of these dimensions creates blind spots that competitors will exploit.
The 7 Critical Analysis Dimensions
1. Revenue & Profitability Performance
Understanding not just what you sold, but what you actually kept
2. Advertising Efficiency & ROI
Evaluating spend effectiveness across all campaign types
3. Operational Performance Metrics
Assessing fulfilment, customer service & account health
4. Product Portfolio Analysis
Identifying winners, losers & strategic opportunities
5. Competitive Position & Market Share
Understanding where you stand versus the competition
6. Content & Conversion Performance
Evaluating listing quality & customer engagement
7. Seasonal Pattern Recognition
Mapping demand cycles for smarter 2026 planning
Step 1: Revenue & Profitability Deep Dive
Revenue growth means nothing if margins are eroding. PRO sellers analyse both top-line & bottom-line performance.
Key Metrics to Review
Total Revenue
- Year-over-year growth percentage
- Month-over-month trends throughout 2025
- Revenue by product category
- Revenue by marketplace (if multi-country)
Unit Sales Volume
- Total units sold in 2025
- Average units per day by quarter
- SKU-level volume analysis
- Seasonal volume patterns
Average Selling Price (ASP)
- ASP trends throughout the year
- Impact of pricing changes on volume
- Competitive pricing position
- Margin impact of ASP fluctuations
True Profit Margin Analysis
Most sellers only look at Amazon fees, but PRO sellers account for:
- Amazon referral fees (8-15% depending on category)
- FBA fulfilment fees
- Storage fees (monthly + long-term)
- Advertising spend (allocated to revenue)
- Returns & refunds
- Cost of goods sold (COGS)
- Inbound shipping to Amazon warehouses
- Payment processing fees
Critical Question: What was your true net profit margin per product after all costs? Many sellers discover they’re profitable overall but losing money on specific SKUs.
RootAMZ Financial Analysis:
RootAMZ builds comprehensive P&L models for Amazon businesses, breaking down profitability by SKU, marketplace & traffic source. We identify which products are subsidising losers & create strategies to improve portfolio-wide margins.
Step 2: Advertising Performance Audit
Amazon advertising likely represents 10-30% of your revenue in 2025. Understanding what worked & what wasted budget is critical for 2026 optimization.
Advertising Metrics That Matter
Overall Advertising Performance
- Total ad spend in 2025
- Total advertising revenue (sales attributed to ads)
- Blended ROAS (Return on Ad Spend)
- ACoS (Advertising Cost of Sale) by month
- TACoS (Total Advertising Cost of Sale)
Campaign Type Performance
Analyse separately:
Sponsored Products
- ROAS by campaign structure (auto vs manual)
- Performance by match type (exact, phrase, broad)
- Keyword-level profitability
- Wasted spend on non-converting terms
Sponsored Brands
- Click-through rate trends
- Conversion rate performance
- Brand awareness impact
- Store traffic generation
Sponsored Display
- Audience targeting effectiveness
- Retargeting campaign performance
- Competitive targeting results
Amazon DSP (if applicable)
- Upper-funnel awareness metrics
- Retargeting efficiency
- Cross-device attribution
Critical Questions to Answer
- Which campaigns generated profitable growth?
- Which campaigns drove revenue but destroyed margins?
- Where did you waste budget on non-converting keywords?
- Which products need MORE advertising investment?
- Which products can scale back advertising & maintain organic sales?
The TACoS Insight
TACoS (Total Advertising Cost of Sale) is your ad spend as a percentage of TOTAL revenue (not just ad-attributed revenue).
- Healthy TACoS: 10-15% for mature products
- Growth-phase TACoS: 20-30% for new launches
- Warning sign: TACoS trending upward = dependency on paid traffic
If your TACoS increased significantly in 2025, your organic ranking & conversion power declined. This must be addressed in 2026.
RootAMZ Advertising Analysis:
RootAMZ conducts forensic advertising audits, identifying budget waste, ranking opportunities & structural inefficiencies. We rebuild advertising architectures that reduce dependency on paid traffic while scaling profitable visibility.
Step 3: Operational Performance Assessment
Amazon rewards operational excellence & punishes mistakes with reduced Buy Box share, search suppression & account warnings.
Seller Performance Metrics to Review
Order Defect Rate (ODR)
- Target: < 1%
- Review your 2025 average & worst months
- Identify root causes of defects
- Action plan to stay under 1% in 2026
Late Shipment Rate
- Target: < 4%
- Review trends (especially during peak seasons)
- Assess fulfilment capacity issues
Pre-Fulfilment Cancel Rate
- Target: < 2.5%
- Identify stockout patterns
- Improve inventory forecasting
Return Rate
- Category-dependent, but track trends
- High returns signal product quality or expectation mismatch issues
- Analyse return reasons for product improvement insights
Customer Response Time
- Target: < 24 hours
- Review message volume trends
- Identify common questions indicating listing deficiencies
Inventory Management Review
Stockout Incidents
- How many times did key products run out of stock?
- Revenue lost during stockout periods
- Impact on organic ranking post-restock
Excess Inventory Costs
- Long-term storage fees paid in 2025
- Slow-moving inventory tying up capital
- Products requiring liquidation
Inventory Turnover Rate
- How many times did you cycle through inventory?
- Optimal turnover balances availability with storage costs
- Target: 6-12x annually for most categories
RootAMZ Operational Excellence:
RootAMZ implements performance monitoring systems, demand forecasting models & automated alert systems that prevent operational failures before they impact your account health or sales velocity.
Step 4: Product Portfolio Performance Matrix
Not all products perform equally. Year-end review must categorise your catalog for strategic decision-making.
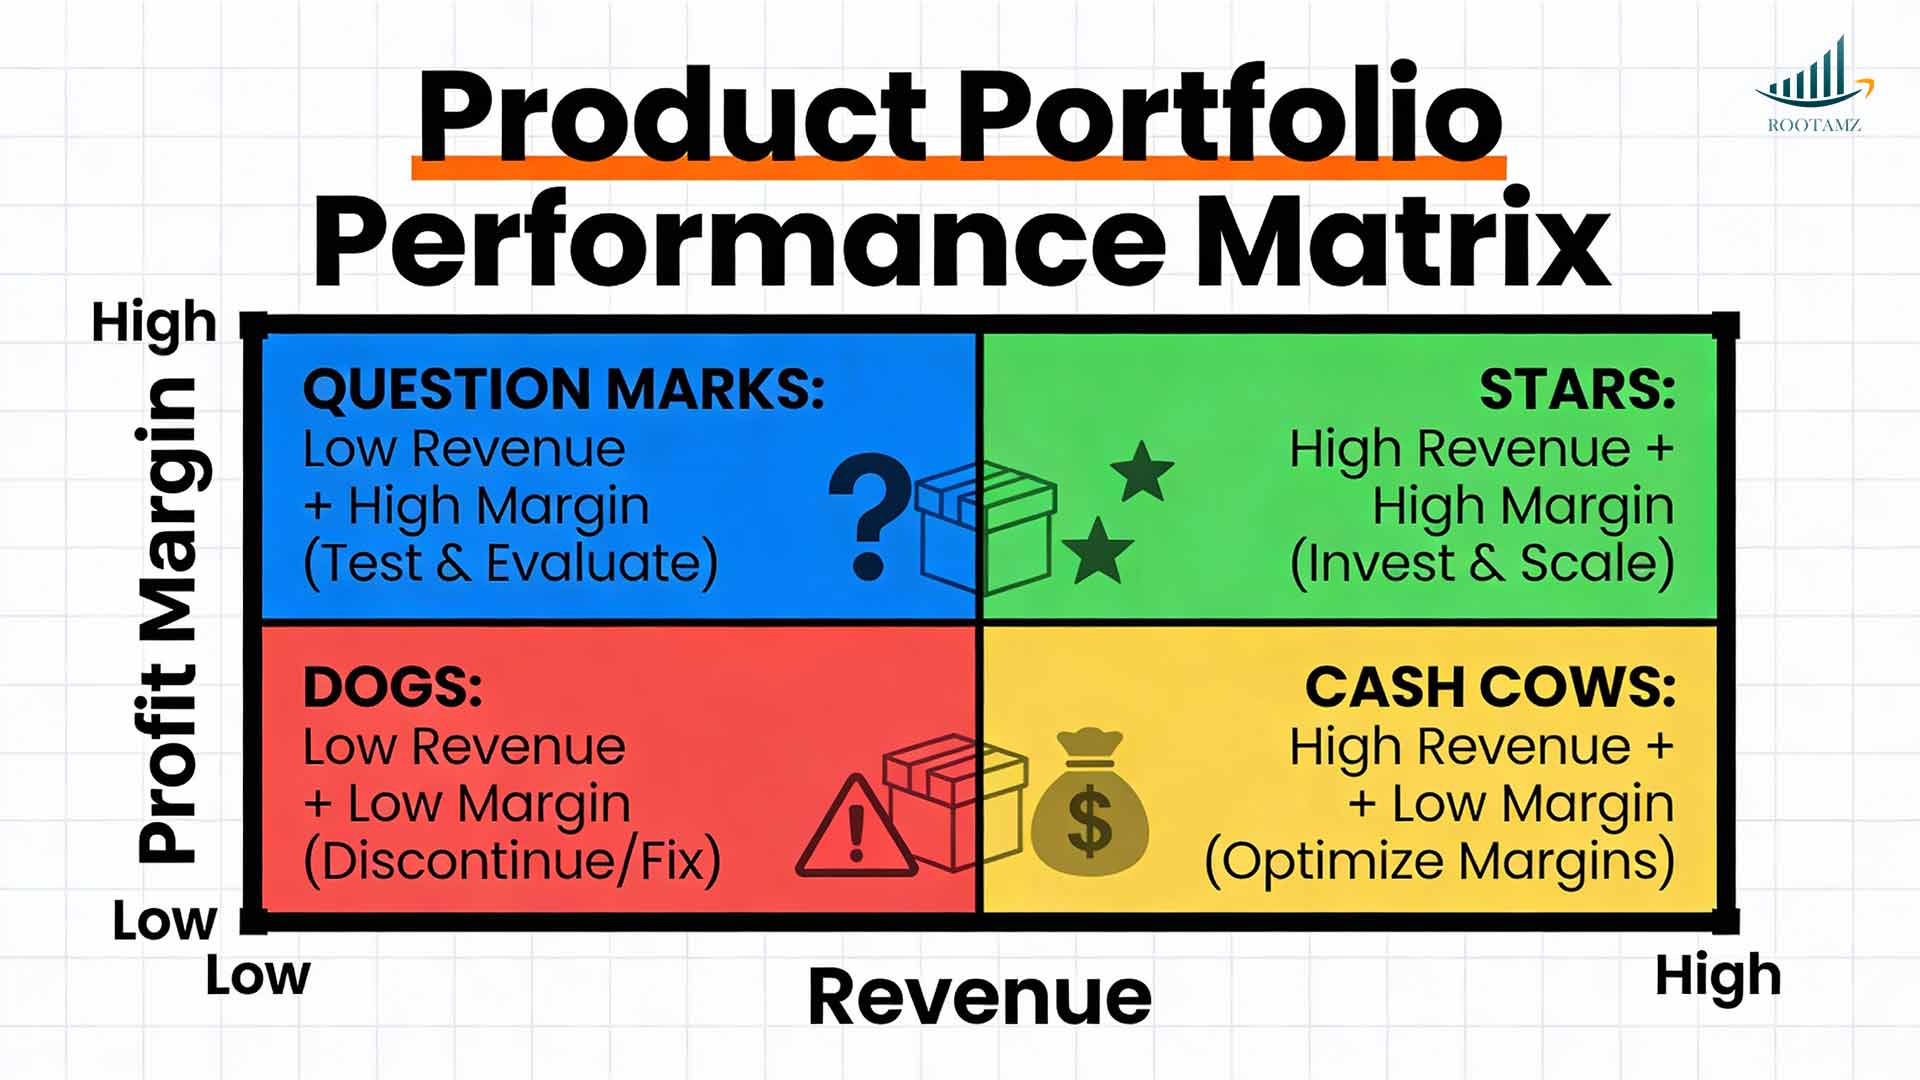
The Portfolio Performance Matrix
Classify each product into one of four categories:
Stars (High Revenue + High Profit Margin)
- Your best performers
- Deserve maximum marketing investment
- Consider product line extensions
- Protect against competitive attacks
Cash Cows (High Revenue + Low/Moderate Margin)
- Generate volume but margin-constrained
- Evaluate cost reduction opportunities
- Consider slight price increases
- Monitor for competitive pricing pressure
Question Marks (Low Revenue + High Margin)
- Profitable but underperforming on visibility
- May need advertising boost
- Could indicate niche opportunity
- Evaluate market size potential
Dogs (Low Revenue + Low Margin)
- Consuming resources without return
- Consider discontinuation
- Or require significant repositioning
- Don’t let emotional attachment cloud judgment
Product Launch Review
For products launched in 2025:
- Which launches exceeded expectations?
- Which underperformed despite investment?
- What did successful launches have in common?
- What mistakes did failed launches share?
Lessons for 2026 Product Strategy
- Should you launch more products or focus on existing winners?
- Which product categories showed strongest demand?
- Where are white space opportunities in your niche?
- Which product extensions would leverage existing success?
RootAMZ Portfolio Strategy:
RootAMZ conducts strategic portfolio reviews, categorising products by strategic value & building action plans for each category, stars get scaling investment, dogs get liquidated or repositioned, question marks get targeted testing.
Step 5: Competitive Position Analysis
Your performance exists in context. Understanding how you performed relative to competitors determines your strategic priorities.
Market Share Assessment
Questions to Answer:
- Did your market share grow or shrink in 2025?
- Which competitors gained ground?
- Which competitors lost visibility?
- What tactics did winners employ?
Tools for Competitive Intelligence
Brand Analytics (Brand Registry Required)
- See top search terms driving traffic to your category
- Understand which competitors appear in customer consideration sets
- Analyse market basket data for bundling opportunities
Helium 10 / Jungle Scout / Other Third-Party Tools
- Track competitor revenue estimates
- Monitor competitor pricing changes
- Analyse competitor review velocity
- Track competitor keyword rankings
Competitive Content Audit
Review top 5 competitors:
- How does their A+ Content compare to yours?
- Are their images higher quality?
- Do they have video where you don’t?
- Are their titles & bullets more compelling?
- Do they have more reviews?
Critical Insight: If competitors improved faster than you in 2025, the gap will widen in 2026 unless you adapt.
RootAMZ Competitive Intelligence:
RootAMZ conducts systematic competitive monitoring, tracking competitor tactics, pricing strategies & content evolution. We identify tactical opportunities & defensive necessities based on competitive movements.
Step 6: Content & Conversion Performance
Your listing content determines whether traffic converts to sales. Review 2025 content performance to guide 2026 improvements.
Conversion Rate Analysis
Overall Conversion Rate
- Your average across all products
- Benchmark: 10-15% is healthy for most categories
- Below 10%: significant content or pricing issues
- Above 15%: strong competitive position
Product-Level Conversion Rates
- Which products convert best?
- Which products get traffic but don’t convert?
- What’s different about high-converters?
Content Experiments Run in 2025
If you used Amazon’s “Manage Your Experiments”:
- Which image changes improved conversion?
- Which title variations performed better?
- Which A+ Content modules resonated?
If you didn’t run experiments, that’s a 2026 priority.
Review Analysis
Review Velocity
- How many reviews did you accumulate in 2025?
- Is review velocity increasing or declining?
- How does your velocity compare to competitors?
Review Sentiment
- What are common positive themes?
- What are recurring complaints?
- Which product aspects do customers praise most?
- Which features need improvement?
Review-Driven Product Improvements
Did you implement any product changes based on customer feedback? If not, you’re missing a massive competitive advantage opportunity.
RootAMZ Content Optimisation:
RootAMZ implements systematic content testing programs, analysing what drives conversion & continuously improving listing quality. We treat Amazon listings as living assets requiring ongoing optimization, not static product pages.
Step 7: Seasonal Pattern Recognition & Planning
Understanding 2025’s seasonal rhythms allows you to plan inventory, advertising & promotions more effectively in 2026.
Monthly Revenue Patterns
Chart your 2025 revenue by month:
- When were your peak months?
- When were slowest periods?
- Did patterns match your expectations?
- How did 2025 compare to 2024?
Event-Based Performance
Review performance during key events:
- Q1: Post-holiday slowdown & Valentine’s Day
- Q2: Spring/Mother’s Day/Memorial Day
- Q3: Back-to-school & summer seasonality
- Q4: Prime Day (July), Black Friday, Cyber Monday, Holiday
Questions:
- Which events drove best performance?
- Which events underperformed expectations?
- Did you have adequate inventory for peaks?
- Did you miss promotional opportunities?
2026 Seasonal Strategy
Based on 2025 patterns:
- When should you increase inventory levels?
- When should you boost advertising investment?
- When should you run promotions?
- When should you launch new products for maximum impact?
RootAMZ Seasonal Planning:
RootAMZ builds predictive demand models based on historical patterns, helping clients front-load inventory, stage advertising campaigns & time promotions for maximum ROI.
Setting Strategic 2026 Goals That Actually Work
Most Amazon sellers set vague goals like “grow revenue 30%” without the strategic roadmap to achieve them. PRO sellers set SMART goals backed by specific tactical plans.
The SMART Goal Framework
Specific: Clearly defined outcome
Measurable: Quantifiable success metrics
Achievable: Realistic given resources
Relevant: Aligned with business priorities
Time-Bound: Deadline-driven with milestones
Sample 2026 Goal Structure
Instead of: “Increase sales”
SMART Goal: “Increase total revenue to $2M (from $1.5M in 2025) by growing Star products 40%, launching 3 new products generating $100K each & improving overall conversion rate from 12% to 14% through content optimization.”
Goal Categories for 2026
Revenue Goals
- Total revenue target
- Revenue by marketplace
- Revenue by product category
- New product revenue target
Profitability Goals
- Target net profit margin
- TACoS reduction target
- Cost reduction initiatives
- Pricing optimization goals
Operational Goals
- Maintain ODR < 1%
- Zero stockouts on Star products
- Reduce inventory carrying costs by X%
- Improve inventory turnover rate
Advertising Goals
- Target blended ROAS
- Reduce wasted ad spend by X%
- Launch X new campaign types
- Improve organic ranking for X keywords
Content Goals
- Update all A+ Content
- Add video to top 10 products
- Increase average review count to X
- Improve average product rating to X
Competitive Goals
- Gain X% market share in primary category
- Outrank competitor Y for Z keywords
- Launch products in competitor blind spots
Breaking Annual Goals into Quarterly Milestones
Annual goals without quarterly checkpoints fail. Break each goal into Q1, Q2, Q3, Q4 milestones with specific KPIs.
Example:
Annual Goal: Increase revenue to $2M
Q1 Target: $400K (focus: inventory positioning, post-holiday promotions)
Q2 Target: $450K (focus: spring launches, content optimization)
Q3 Target: $550K (focus: Prime Day preparation, back-to-school)
Q4 Target: $600K (focus: holiday season execution)
RootAMZ Strategic Planning:
RootAMZ transforms vague aspirations into executable strategic plans with specific tactics, resource requirements, timeline dependencies & success metrics. We provide quarterly business reviews to assess progress & adjust strategies based on market conditions.
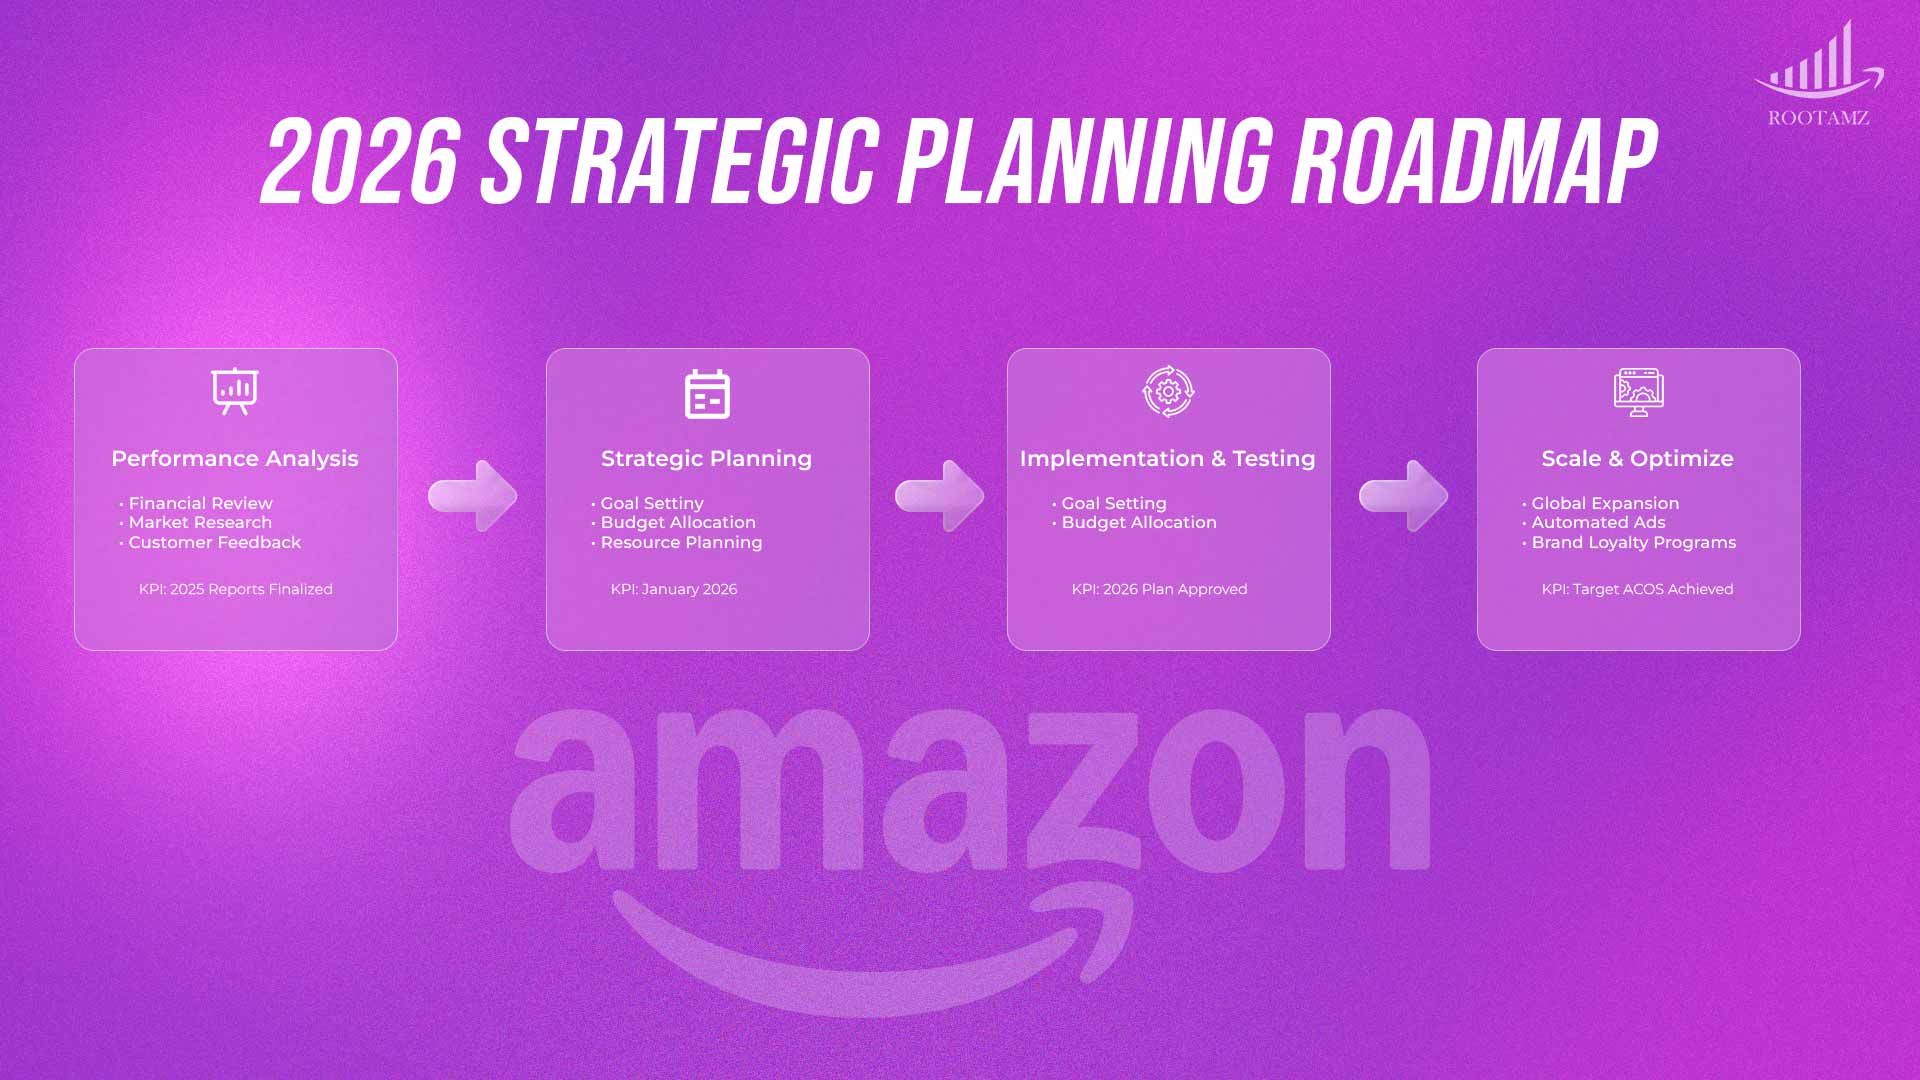
Your 2026 Action Plan Timeline
December 2025: Complete performance analysis
January 2026: Finalize strategic plan & Q1 tactical roadmap
February 2026: Implement Q1 initiatives & monitor early results
March 2026: Q1 review & Q2 planning refinement
Quarterly thereafter: Review, learn, adjust, execute
Why RootAMZ Is Your Year-End Analysis & Strategic Planning Partner
Analysing 12 months of Amazon data requires expertise in:
- Financial modelling
- Advertising analytics
- Competitive intelligence
- Operational diagnostics
- Content performance evaluation
- Strategic planning methodology
Most sellers lack the time, tools or expertise to conduct thorough analysis & build executable plans.
RootAMZ Year-End Review Services Include:
- Comprehensive Performance Audit
- Financial Profitability Analysis by SKU
- Advertising Efficiency Deep Dive
- Operational Health Assessment
- Competitive Position Analysis
- Content & Conversion Evaluation
- Strategic 2026 Goal Setting
- Quarterly Tactical Roadmap Development
- Ongoing Quarterly Business Reviews
We don’t just show you what happened, we tell you what it means & exactly what to do about it.
Final Thought: Year-End Analysis Isn’t Optional, It’s Strategic Necessity
In Amazon’s hyper-competitive marketplace, brands that understand their performance deeply & plan strategically dominate those that simply react to circumstances.
2025 is nearly over. The question isn’t whether you’ll review your performance, it’s whether you’ll do it thoroughly enough to build a winning 2026 strategy.
The brands that will win in 2026 are those analysing performance right now, extracting insights & building tactical roadmaps that compound growth.
RootAMZ is your partner for exactly that.
FAQ’S
When should I conduct my year-end Amazon performance review?
Ideally in December after Black Friday/Cyber Monday concludes but before January, allowing you to start 2026 with a clear strategic plan.
What data do I need to conduct a thorough analysis?
Amazon Business Reports, Advertising Console data, Brand Analytics (if enrolled in Brand Registry), financial records including COGS, inventory reports & customer service metric
How long does a comprehensive year-end analysis take?
For individual sellers, 10-20 hours. RootAMZ conducts professional audits in 5-7 business days with detailed strategic recommendations.
Should I analyze every product individually?
Yes for your top revenue generators (typically 20% of SKUs driving 80% of revenue). Other products can be analysed in aggregate categories.
Can RootAMZ help if I don't have Brand Registry or limited data access?
Absolutely. We work with whatever data is available & help you implement better tracking systems for 2026 forward.